
SPI compares a district’s current reporting with earlier reporting and the national pattern. It divides reported cases by expected cases, then divides the result by the national ratio for the same period. The simple SPI calculates expected counts from the district’s own earlier rate. The model-based SPI estimates them with a spatial and temporal model. This article explains both calculations and their limitations. For worked examples, see Calculating the simple SPI and Calculating the model-based SPI.
The comparison
For district and assessment year , let be the reported NPAFP count and the expected count, estimated from years before only. The district’s observed-to-expected ratio is . SPI divides it by the national ratio for the same year:
An SPI of 1 means the district’s ratio equals the national ratio. The two methods differ in how they calculate and which districts they include in the national sums.
| Simple SPI | Model-based SPI | |
|---|---|---|
| Reporting history | The district’s cases and child-years over all earlier years | Earlier months of all districts, through the fitted model |
| Population adjustment | Expected count is current population times the earlier rate | Log exposure as an offset, a term whose coefficient is fixed at 1 |
| Information from other districts | None | Partial pooling and a spatial effect, with more influence where a district’s own data provide little information |
| Seasonality and year effects | None; annual counts only | Harmonic seasonality and an exchangeable year effect |
| National centring | Always applied | Default; centre = "none" returns the uncentred
ratio |
| Uncertainty | None; one value per district-year | Posterior medians and 90% credible intervals, reflecting uncertainty in expected counts |
The simple SPI
spi_simple() calculates the expected count from the
district’s own earlier reporting. For district
and assessment year
,
NPAFP cases and annual under-15 populations are added across all earlier
years
in the data:
Here is earlier exposure in child-years, and all rates in the equations are per child-year. The output tables multiply rates by 100,000 by default. The previous rate is defined only when .
History check. A positive expected count can be
calculated when the district has at least one earlier year and at least
one earlier case. With earlier years but no earlier case
(),
,
the expected count is 0, and O/E and SPI are NA;
history_check is "no previous case". With no
earlier year
(),
,
the expected count, O/E and SPI are all NA;
history_check is "no previous year". Otherwise
history_check is "ok". The district’s previous
rate is used unchanged.
Index. , calculated as , and
The national observed-to-expected ratio is calculated from
district-years with a positive expected count. Districts with no
positive expectation do not contribute to national centring. A zero
national ratio gives NA for every district’s SPI, including
those with history_check = "ok".
Population check. Each district’s consecutive-year change in log population is compared with the median change across districts in the same year. A change is unusual when its deviation lies outside Tukey’s far-out fences (three interquartile ranges beyond the quartiles) and has absolute magnitude greater than . This is a multiplicative threshold relative to the median growth factor: above 1.1 or below , rather than a symmetric 10% change in population. Fences are calculated from all available consecutive-year deviations; fewer than four deviations give no change flags.
For each assessment year, the check considers the district’s
population records up to that year. population_qc is
check_spike when an unusual deviation is followed by an
unusual deviation in the opposite direction among the next two recorded
transitions, check_change for any other unusual deviation,
check_history when population records do not cover all
dataset years up to that year, and ok otherwise. These
labels take precedence in that order. With a complete annual series, the
two transitions cover two years; gaps can extend that interval. The
check does not alter populations.
The model-based SPI
spi_index() estimates expected counts with the model
below. It fits the model for each assessment year using preceding years
only, so the year being assessed does not contribute to its own
expectation. In the accompanying study, each district’s earlier
reporting provided most of the basis for its expected counts.
Information from other districts contributed more when the district’s
own history provided little information.
Model specification
With annual population data, the default model without covariates estimates expected counts for each district and month :
where
- is the district’s annual under-15 population for the year containing month ; approximates that month’s exposure in child-years
- is the background log rate; is the rate per child-year when the other terms are zero
- is harmonic seasonality (12- and 6-month periodicity)
- is an exchangeable year effect
- is a BYM2 spatial random effect (Riebler et al. 2016)
- is the negative binomial size parameter, with ; larger values approach the Poisson model
The INLA BYM2 parameterisation is
where is the scaled, spatially structured effect and is an independent standard normal effect. The precision controls the overall scale and controls the balance between the two components. The package applies scaling and constraints separately to disconnected components of the adjacency graph.
The negative
binomial parameterisation above is the default
overdispersion = "nb". If population data are supplied by
month, the package instead uses log(pop) directly: those
values must already represent monthly exposure in child-years.
Optional covariates add to the linear predictor. They are not part of the default SPI used in the accompanying study.
overdispersion = "iid" uses a Poisson model with an
independent normal observation-level term
in the linear predictor. "none" fits a Poisson model
without that extra term. Use spi_compare_overdispersion()
to compare the three options.
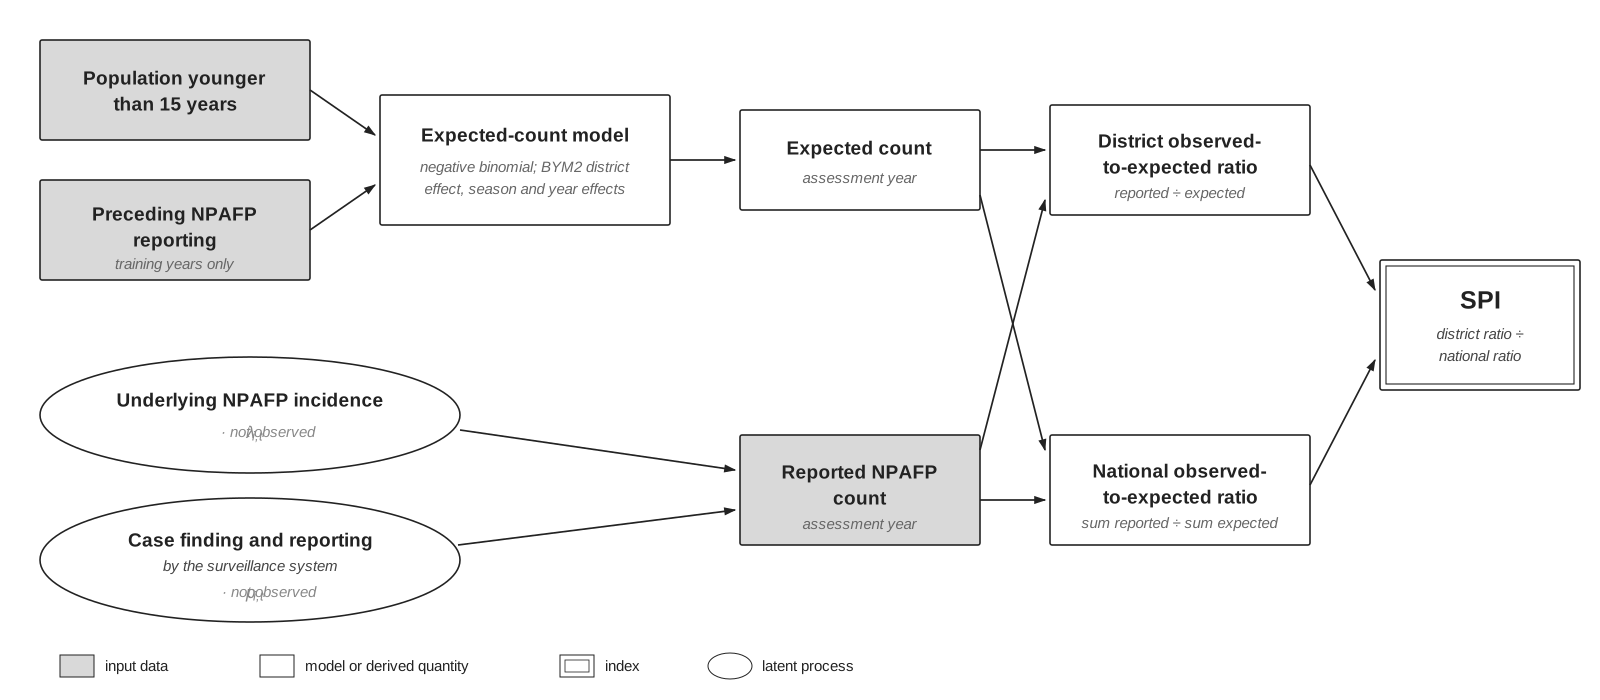
Reported counts reflect both underlying NPAFP incidence and
surveillance reporting. spi_index() estimates each year’s
expected counts from preceding years only.
National centring and uncertainty
For district and year , let be the annual observed count. Within each posterior draw , sum the monthly expected counts first:
The annual median is therefore taken after summing months. The default index is calculated for each draw as
The national ratio is calculated within the same draw as the district
ratio. Uncertainty shared by every district in a year, such as a common
year effect, therefore cancels before the medians and credible intervals
are taken. Within each draw, the expected-count-weighted mean of the
centred index is exactly 1. SPI medians and credible intervals summarise
the centred draws. They reflect uncertainty in the expected counts,
conditional on observed counts, and do not include extra variation from
simulated future counts. spi_dy$national reports
divided by the median of
.
In particular, zero observed cases give zero SPI in every draw when the
expected counts and national ratio are positive.
National sums include rows with finite observed counts and finite,
positive expected counts. A year with no observed cases nationally has
an undefined centred SPI, returned as NA.
centre = "none" returns the uncentred observed-to-expected
ratio.
Limitations
These limits follow from how the reference is estimated and how the ratio is centred:
| Limitation | What to check |
|---|---|
| Persistent low reporting can become the baseline | A district with years of low reporting can have an SPI near 1. Keep the conventional NPAFP target as an external benchmark; persistent failure to meet it remains a reason for closer review. |
National change is removed when
centre = "national"
|
Review the national observed-to-expected ratio in
spi_dy$national separately. SPI describes relative district
differences, so a shared decline can leave district SPI values largely
unchanged. Also inspect absolute reporting rates and counts. |
| Population and boundary errors affect the comparison | Population error affects both expected counts and the conventional rate. Check denominators and use consistent boundaries across years, especially after district splits or mergers. |
| Simple SPI can be unstable with little history | The earlier rate is used unchanged, even when based on a single case. Review earlier years, cases and child-years. With no earlier case or year, SPI is unavailable. |
| Model-based estimates use more information from other districts when history is limited | Sparse reporting histories give the model less district-specific information. Review the available history and uncertainty before interpreting changes. |
| Using neighbours in the model can reduce estimated differences between districts | Sharing information improves stability but can pull an unusual district towards its neighbours. Check local counts and context when the fitted expectation seems implausible. |
| Results depend on model choices | The training period, spatial structure, seasonality, priors, and centring affect results. Keep these choices consistent when comparing years and assess sensitivity to plausible alternatives. |
SPI does not directly estimate missed cases, detection probability, poliovirus circulation, outbreak risk, or overall surveillance quality.