
Calculates the surveillance performance index (SPI) for each district and assessment year from earlier NPAFP counts and population estimates, without fitting the INLA spatial and temporal model. A district's expected count is its NPAFP rate over all preceding years multiplied by its current population. The district observed-to-expected ratio is then divided by the national observed-to-expected ratio for the same year.
Inspect the inputs and calculation for one district with spi_simple_explain().
Usage
spi_simple(
  data,
  population = NULL,
  id_col = "district",
  year_col = "year",
  count_col = "npafp_cases",
  pop_col = "population_u15",
  first_assessment = NULL,
  last_assessment = NULL,
  min_history = 3L,
  per = 1e+05,
  verbose = TRUE
)
Arguments
- data
Data frame with one row per district and year: the district identifier (
id_col), the year (year_col), the number of NPAFP cases (count_col) and the population under 15 (pop_col). A table with columnsdistrict,year,npafp_casesandpopulation_u15needs no other argument.- population
Optional data frame with one row per district and year, for when the population is held in a separate table: the district identifier, the year and the population under 15 (
pop_col). It then defines which districts and years are assessed; a district-year with no row indatais counted as zero cases. DefaultNULL: the population is taken fromdata.- id_col, year_col, count_col, pop_col
Character. Column names in
dataandpopulation. Defaults"district","year","npafp_cases"and"population_u15".- first_assessment
Integer. First assessment year. Default: the first year in the data plus
min_history.- last_assessment
Integer. Last assessment year. Default: the last year in the data.
- min_history
Integer. Calendar years after the first data year before assessment starts when
first_assessmentis not given. Default 3. This does not require every district to have that many earlier records.- per
Numeric. Rates are reported per this many people. Default 100000.
- verbose
Logical. Print progress and a summary. Default
TRUE.
Value
An spi_simple object, a list with:
summary: one row per district and assessment year withobserved,pop,npafp_rate,history_years,history_cases,history_pop(preceding child-years),history_rate,history_check,expected,oe,national_oe,spiandpopulation_qc. Rates are perper.national: observed, expected and the national observed-to-expected ratio for each assessment year.population_qc: the population check for each district.metadata: the arguments and data range used.
print() gives a short country summary, summary() a fuller report and
as_tibble() the summary table.
Details
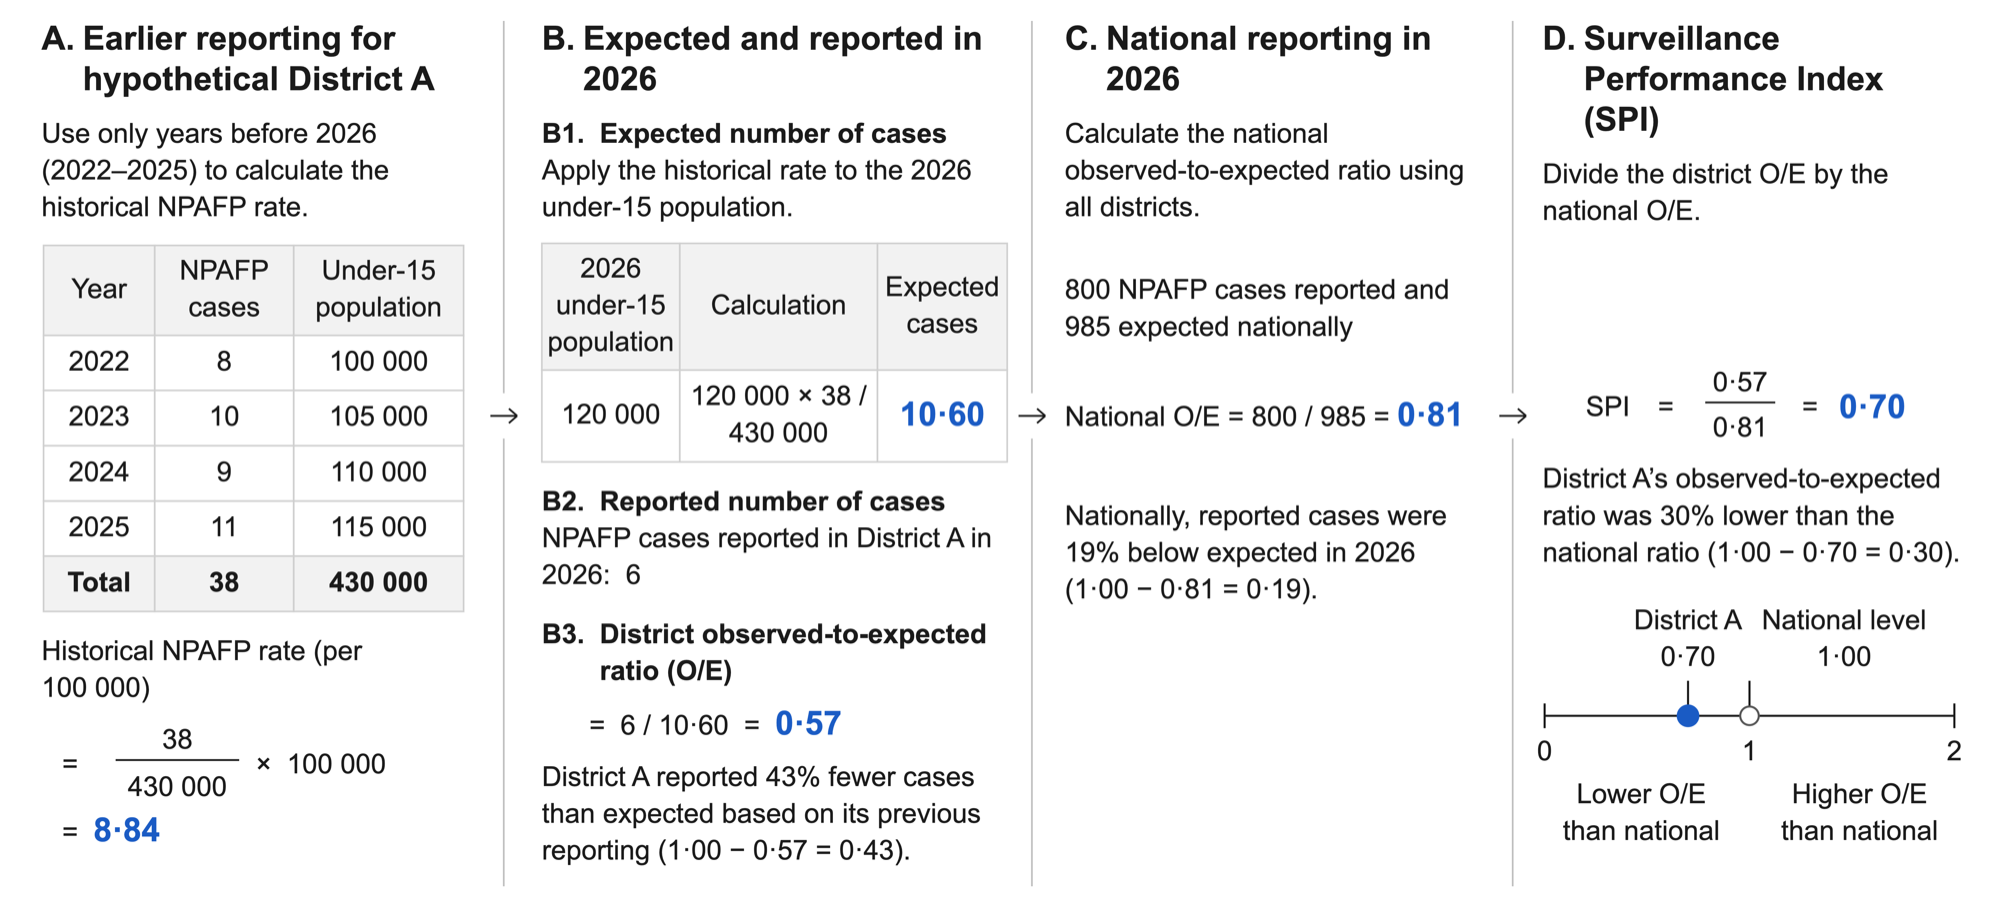
Steps for each assessment year. Only years before the assessment year enter the expectation.
Add up each district's preceding NPAFP cases and preceding population (child-years), and divide to get its historical rate.
Expected cases = current population x historical rate.
Divide observed by expected cases.
Divide that ratio by the national ratio, using observed and expected totals from districts with a positive expected count. The result is SPI.
The figure works through these steps for a hypothetical district.
When the SPI cannot be calculated. history_check records whether the
district's history supports the calculation. "ok": a positive expected
count can be calculated. "no previous case": the district has earlier years but no
NPAFP case in them, so its historical rate and expected count are 0 and the
observed-to-expected ratio and SPI are NA. "no previous year": the
district has no earlier year in the data (for example a new district), so
its historical rate, expected count, observed-to-expected ratio and SPI are
all NA. A district with one earlier year gets an SPI; history_years,
history_cases and history_pop show how much history lies behind it.
National centring. The national observed-to-expected ratio is
calculated from district-years with a positive expected count. Districts
for which the simple SPI cannot be calculated do not contribute to national
centring.
If the included districts report no cases in the assessment year, the
national ratio is zero and all centred SPI values are NA, even for
districts whose history_check is "ok".
Population check. Expected cases depend on the population, so each
district's population series is screened before calculation. Each
consecutive-year change in log population is compared with the median
change across districts in the same year. A change is unusual when its
deviation lies outside
Tukey's far-out fences (three interquartile ranges beyond the quartiles)
of all such deviations and exceeds log(1.1) in absolute magnitude.
This corresponds to a growth factor above 1.1 or below 1/1.1 times the
median growth factor. population_qc is "check_spike" when an unusual
deviation is followed by one in the opposite direction among the next
two recorded transitions (two years when the annual series is complete),
"check_change" for any other unusual change, "check_history" when the
population records do not cover all dataset years up to the assessment year,
and "ok" otherwise. Flags identify unusual patterns for review; they do
not imply that the population is incorrect, and supplied populations are
never altered.
See also
spi_simple_explain(), vignette("spi-simple"), and
spi_index() for the model-based SPI.
Examples
annual <- synth_surveillance$cases |>
  dplyr::mutate(year = as.integer(format(month, "%Y"))) |>
  dplyr::summarise(count = sum(count), .by = c(adm2_guid, year))

res <- spi_simple(
  data = annual,
  population = synth_surveillance$population,
  id_col = "adm2_guid",
  count_col = "count",
  pop_col = "pop_u15",
  verbose = FALSE
)
res
#>
#> ── Simple SPI ──
#>
#> Assessment years:   2018-2024
#> Districts:          236
#> Latest assessment:  2024
#> SPI < 1:            141 (60%)
#> SPI < 0.8:          93 (39%)
#> SPI < 0.6:          56 (24%)
#> Population flags:   0
#> No SPI:             0
#> Use summary() for the full report, as_tibble() for the table and
#> spi_simple_explain() for one district.